Nonlinear Programming#
Binary Genetic Algorithm (BGA)#
[1]:
from neumann.optimize import BinaryGeneticAlgorithm


def Rosenbrock(x):
    a, b = 1, 100
    return (a-x[0])**2 + b*(x[1]-x[0]**2)**2


ranges = [[-10, 10], [-10, 10]]
BGA = BinaryGeneticAlgorithm(Rosenbrock, ranges, length=12, nPop=200)
BGA.solve()
[1]:
array([0.94993895, 0.9010989 ])
Iterative Solution using BGA.evolve#
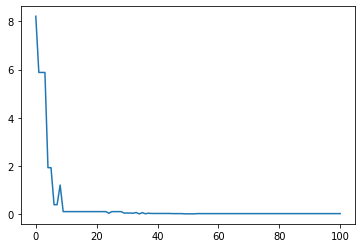
Here we keep track of the best candidate and plot a history chart using matplotlib. The evolve call on the object performs a specified number of cycles, while best_phenotype returns the best candidate in general format.
[2]:
import matplotlib.pyplot as plt

import pyvista

BGA = BinaryGeneticAlgorithm(Rosenbrock, ranges, length=12, nPop=200)
history = [Rosenbrock(BGA.best_phenotype())]
for _ in range(100):
    BGA.evolve(1)
    history.append(Rosenbrock(BGA.best_phenotype()))
plt.plot(history)
plt.show()
x = BGA.best_phenotype()
fx = Rosenbrock(x)